
Blogs & Opinions 06.02.2025
CISO “How to” Without the Bull: Cyber-Risk Management (Pt 2)
The second half of a seven-point plan for success
Blogs & Opinions 06.02.2025
The second half of a seven-point plan for success
In the first part of this two-part blog, I introduced my BS-free guide to cyber-risk management, covering the first three steps and the top-down and bottom-up approaches. Let’s pick it up from where we left off, with a reminder that the following has been written for either CISOs working in a greenfield environment, or those wanting to tweak their processes.
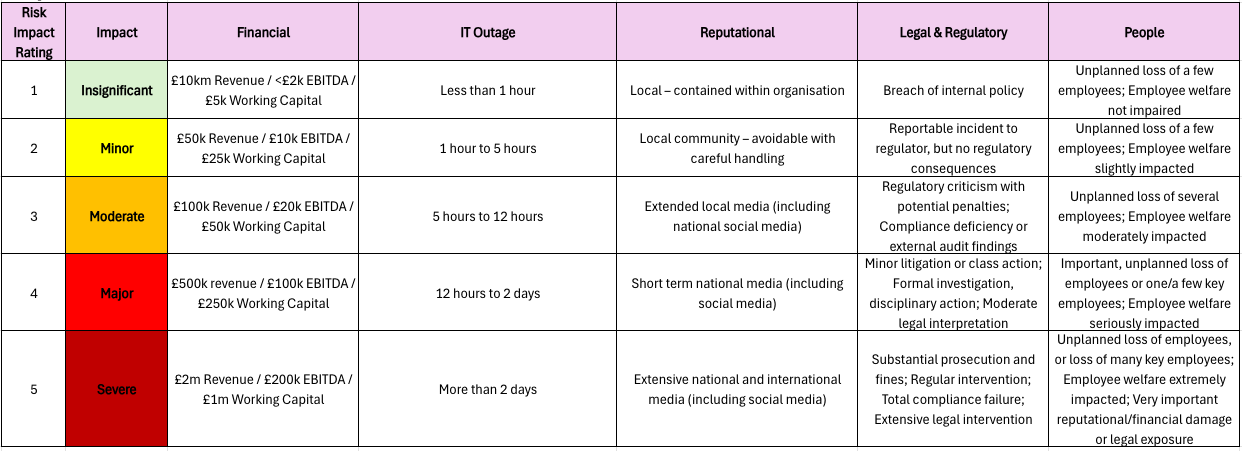
Whether you’re taking a bottom-up (functional risks) or top-down (application risks) approach, the impact and likelihood scoring criteria will be the same, and it’s the best and easiest way to prioritise your risks that need the most attention. I’ll propose a solution below but, of course, check if your business already has its own scoring you can align to. This way, you’re comparing the same risk scoring levels across the business.
Single definitions of a 1-5 are too vague and full Monte-Carlo’d analysis is beyond most of us. The impact of a cyber incident can be multi-faceted, so we need a standardised way of aligning the risk impact scoring across every risk that is captured. The impact reference table below (please adjust as you need) provides a clear way to score each risk in a more helpful way than simple definitions of 1-5.
For the likelihood, a similar table allows a repeatable and standardised way of scoring risk. Once again, feel free to adjust the below as you need.
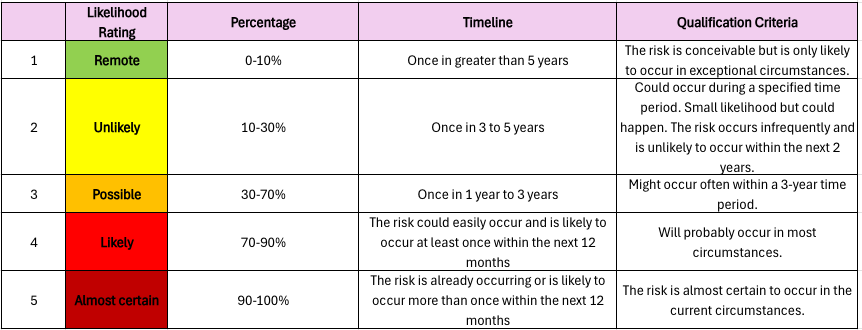
Taking your risk x likelihood scoring, you will have an inherent risk score (pre controls/mitigations) to add to your risk registers, or plot on an impact likelihood graph for better visualisation.
Calculating inherent risk is great, but the residual risk is where the needle gets moved and therefore where the time and effort is really needed. For this, we need to know which controls are in place and which should be in place to bring the risk within an acceptable tolerance.
We’ve done a lot of data capture so far, and built some great relationships across the business, but what we’re really looking to do is reduce our risks. Taking application and function risks in turn, we can make this as easy as possible:
Application risks (top down): The approach to securing information residing in applications can be the same, with the same controls. My suggestion is to take your critical apps and determine if the following key controls are effective or not:
“The impact of a cyber incident can be multi-faceted, so we need a standardised way of aligning the risk impact scoring across every risk” Nick Harris
Presented in one register, you’ll see which critical assets are more critical than others, which are more at risk than others due to missing controls and which controls are the least effective across the board. Based on the missing or ineffective controls, you can score each critical asset again for residual risk, using the same tables above. If this risk still remains too high, soft skills are needed to work out a plan with the application owner to bolster app security further.
Functional risks (bottom up): The second risk register covers all your function risks based on the reworded framework clauses/controls you’ve previously done in part 1 of this blog. Calculating residual risk is a slower process than the one for applications as there are so many more controls to work with. Work on each risk in turn and use your judgement to assign the best controls to mitigate them. The risk owners also need to be present to agree these are the right controls, and set an action plan with you to address any shortfalls needed to hit their threshold.
Measure that needle: With the risk registers now complete, it is a continuous task to ensure action plans are on track, help unblock issues, update changes to risk registers as needed, and to report. Reporting comes in a few flavours:
-Percentage of endpoint detection and response agent coverage
-Percentage of staff not completing their induction training within a specific timeline
-Number of new supply chain security assessments overdue
-Number of critical OS vulnerabilities older than 30 days, not patched on endpoint devices
-Percentage of P1 and P2 incidents with delayed response times (based on your SLAs)
If reporting this outside of simply using the metrics to measure risk, take only a few key metrics that are relevant to the audience to provide a more bespoke, tailored and therefore useful message. E.g. training levels per department head.
Explaining the value of this risk process and the management of the risks themselves, is key. It justifies the time and the spend, and highlights the effort being made. It’s therefore important to use language that demonstrates the value of cybersecurity, and which the business understands. Here are some examples of what you shouldn’t and should say:
Hopefully you can tell the difference in the language and what is likely to resonate more with the business.
You can supercharge risk creation with ChatGPT or your LLM of choosing. The tool won’t know which apps you use, but it can create a basic functional risk register. Try this prompt featuring the risk impact and risk likelihood tables:
“Acme inc is an online retail company of 250,000 customers and a revenue of £320 million using acme.com. With this data and further available public, online information, provide four main risk titles and descriptions that encapsulate its entire cybersecurity and privacy risk.
“Calculating inherent risk is great, but the residual risk is where the needle really gets moved” Nick Harris
Now, using NIST CSF 2.0 sub-categories, reword those you deem to be applicable as risks to Acme inc. For each of these, provide a longer risk description of no more than 40 words, score the inherent risk using the likelihood and impact risk tables attached and recommend controls most appropriate to mitigate these risks.
Link each risk to one of the four main risks previously defined, and use the previously calculated inherent risk scores to give these four main risks their inherent risk scores. For all this data, provide a table that I can copy into excel.”
You must go back and validate the risk wording, the scores and the suggested controls. If you know already which controls are effective, feed this into the next prompt and ask for residual risk scores. While this prompt might only get you 80% of the way there, it’s a great start.
So far, our risk scoring has been qualitative; using definitions of 1-5 impact and likelihood. However, there is a quick way to assign some financial values to both your risks and the cost of the controls. This can be used to justify the cost of the cybersecurity programme and also support how much risk needs mitigating with insurance. We’ll base this on the ICS2 methodology below with some tweaks:
Annualised loss expectancy = asset value (£) x exposure factor (%) x annualised rate of occurrence (0-1)
Starting with the tier 1 risk and using the figures in the above calculation for the tier 2 risks, we can attribute a value to each in a graphical representation, as per the example below. Each column forms a value to feed the calculation which eventually reaches an ALE for each tier 2 risk. This can be used to calculate a single total or risk loss for your ultimate tier 1 risk.
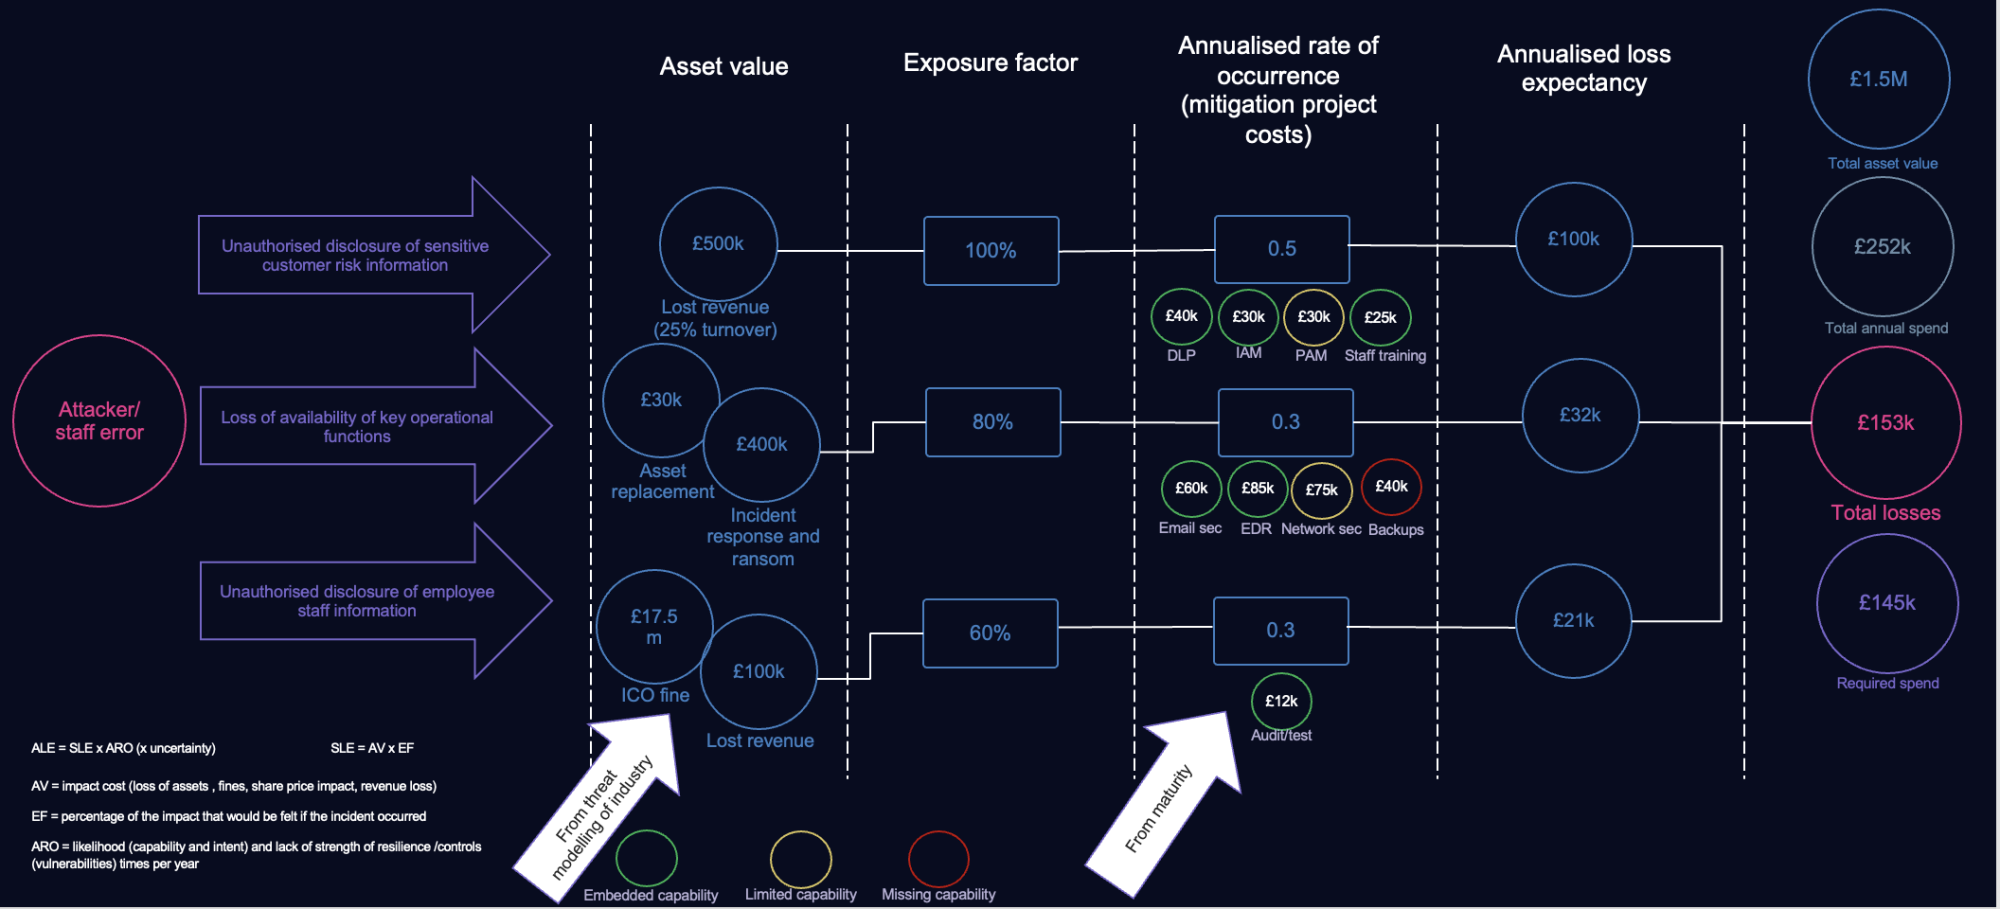
It’s not full Monte-Carlo methodology, but hopefully you can see how to get to a rough value very quicky. The additional detail here is that for each risk, the cost of mitigating the exposure factor is calculated. It is then totalled at the end, alongside the remaining cost of fully mitigating the risks to an accepted threshold level. This way, the mitigation costs, inherent risk and residual risk can be compared in the same place.
I’d love to hear your thoughts on what has worked and where you have tried different approaches that are equally valuable in sharing.
 This article is part of our ‘No bullshit cyber blog’ series, written by Assured CISO in residence, Nick Harris. “These blogs are designed to offer useful tips for implementing cybersecurity practice. The series focuses on making a difference in a language the business understands,” explains Harris. “All points are drawn from my personal experiences delivering cybersecurity transformation programmes and consider best practices from other industries. While I’ve had great success with these methods, you may have a better way. Apply what works for you, and let me know your suggestions.”

Weekly Cyber Briefing 03.04.2026
Updates urged for BIG-IP and FortiClient EMS customers; open-source attackers hijack Axios and Telnyx; and the NCSC warns high-risk individuals about Russian messaging threats

Weekly Cyber Briefing 27.03.2026
A sophisticated supply chain attack compromises Trivy; firms are urged to patch two Citrix flaws; prompt poaching attacks surge; and Tycoon2FA is back up and running

Blogs & Opinions 26.03.2026
Certification won’t stop an attack. Leadership, visibility and continuous improvement will.